


Web development took another step as automation would be included in the testing process. Highly developed businesses had their QA environments to monitor launches in development application meets the increased workloads create automated test suites. They then used them to protect themselves from regression tests and ensure correct productive behaviour. So businesses have designed test suites, and their controls have been automated.
The performance testing of web applications plays a vital role in the deployment process. In web development, performance testing requires software tools such as the Jmeter web application test tool to simulate a particular application. Metrics like response time are examined by quantitative performance tests, while qualitative tests focus on scalability, reliability, and interoperability.
What is Performance testing?
Testing the website or the application’s output helps you to find problems and enhance overall performance, resulting in an enhanced user experience and income. The JMeter performance assessment tool allows both static and dynamic tools to be tested, helps users on the Web site explore, and offers several graphical analyses for performance analysis. The performance monitoring of JMeter consists of load testing and stress testing of a web application.
Types for performance testing
Though the tools for testing websites are helpful and can give you a fast overview of the pace and overall performance of a website, you can perform a more detailed test using a range of tests:
- Load tests: Load tests analyze how increased workload impacts the response time of an application. For instance, you can utilize tools for load testing to see how your app functions with a given number of simultaneous users. The purpose of the load test is to determine the behavior of your application in normal working environments.
- Stress tests: Stress tests are similar to load tests, also known as fatigue tests, but they examine how an app is performed outside the standard work practices. The objective of stress testing is to assess how many competing users or transactions can manage the application until it breaks down. Charging and stress checks will assist you in identifying bottlenecks and deciding how to best use your tools to increase traffic.
- Spike tests: The spike test is a specific stress test for simulating the application’s output if the workload is rapidly and repeatedly raised.
- Endurance tests: Long-term endurance tests, also known as soak tests, evaluate application efficiency. Endurance inspections can help you recognize infrequent memory leakage and comparable situations.
- Scalability tests: Scalability tests examine how well the application fulfills the increased workloads. In contrast to spike tests, scalability testing increases workloads progressively while monitoring output consequences. The resource usage might also vary as long as your workload is the same.
- Volume tests: Volume tests, also called flood tests and specially designed to detect how the application handles a massive amount of data.
How to use JMeter to test the performance of web applications?
The JMeter performance test comprises the web application’s load and stress test.JMeter Load Testing is a test methodology designed to determine whether or not high load requirements can be met with a web application under examination. Each web server has high load capability. The Webserver starts responding slowly and makes mistakes when the charge exceeds the limit. Stress testing is to locate the load that the webserver can handle.

Before we test the performance of the target web app, we should decide the following:
- Normal load: Average number of visitors to your site
- High Load: High Load: The highest number of users visiting your site
- In this test, what is your objective?
Step 1) Add Thread Group
- Start JMeter
- Select Test Plan on the tree
- Add Thread Group
Right-click “Test Plan” and add a new group of threads: Add -> User Threads -> Group Threads.
Enter thread properties as follows in the Control Panel of the Thread Group:
Thread Number: 100 (Number of users who link to the website target: 100)
Loop Count: 10 Loop count, for several test times
Ramp Up Period: 100.
JMeter is told how long the Ramp-up Period should be before the next user starts. If there are 100 users and a 100-second extension period, the late time would be 1 second between commencing users (100 seconds/100 users).
Step 2) Add JMeter elements.
We now determine the components of JMeter for this test. The components are
- Default HTTP application
- By right-clicking the “Add-> Config Element -> HTTP Request Default” element, this element can be inserted.
- Enter the Website name under test in the HTTP default control panel
- Right-click Thread Group and Select Add -> Sampler -> HTTP request.
- The field of Path shows the URL request you wish to submit to the Google server in the HTTP Request Control Panel.
Step 3) Add Graph result.
- JMeter can show the test result in graphical format.
- Click on a Test Plan, Add -> Listener -> Graph results.
Step 4) Run Test and get the test result.
To start the software testing process, click the Run button (Ctrl + R) on the Toolbar. The test result will be displayed in real-time on the Graph.
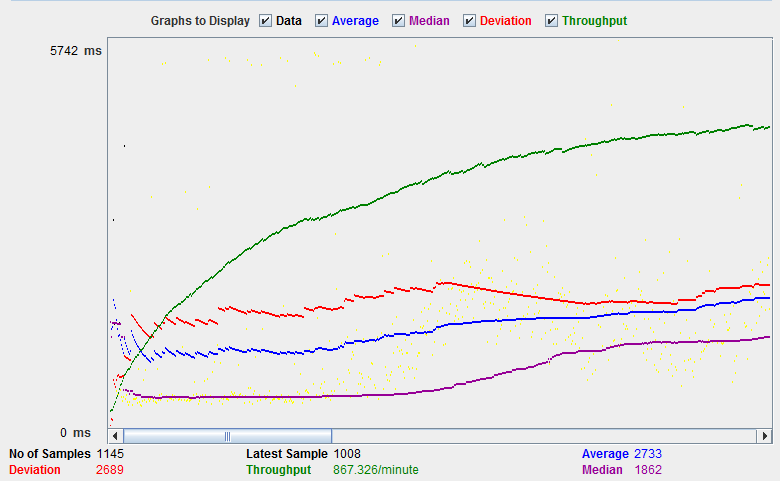
The following photo shows a graph of a test plan in which 100 users who have accessed the website www.google.com were simulated.
You should focus on two parameters to examine the results of the web server being tested.
- Deviation
- Throughput
The main parameter is the Throughput It shows the server’s ability to manage a large amount of traffic. The larger the performance, the greater the performance of the servers.
A deviation appears in red – the difference from the average is indicated—the better, the smaller.
Conclusion:
You may start with improvement goals from the start. But you also might content yourself for the time being. Either way, make sure to evaluate both your test results and your evolving need, using the JMeter tool for performance testing of the websites.
At Krify, we have a team of professional quality analysts, who make sure to deploy the end results with perfect testing and do not compromise on the quality standards. If you are looking to know more about performance testing using the JMeter tool, contact us.